Data science is used for lots of tasks, including selecting the best ads to make users click on it, because companies need people to buy their product!
In this article I will explain how to perform ad targeting with reinforcement learning.
Our goal
We are managing a news website with lots of articles and pages, visited by many users. We want to monetize our content by placing ads on our website, but we can’t randomly assign ads to articles, we need to find a way to put relevant ads in articles. Let’s say everytime a user requests a page we can choose which ad the user will see, and we can record whether he clicked on the ad.
How can we maximize the number of clicks on our ads?
Multi-armed bandits (MAB)
This is a multi-armed bandit problem: at each turn we can choose one action (one ad) from a limited choice, without knowledge of the reward associated to each action. We can only learn from past experiences what actions are the most lucrative, to choose the future actions.
What is the multi-armed bandit problem?
Let’s assume we are in a weird casino with some free bandit machines in front of us. These machines do not require us to put money inside, we juste have to pull the arm and we could receive money. We have no knowledge about these machines, there may be one machine that will give us 1$ every time we press a button, and another machine that give us 100$ once every 10 pushes… The question is the following: “Without knowledge of the outcomes and their probabilities, what strategy is the best to maximize my gains?”
We could use 5 times each machine, then keep using the one that is the most lucrative. In our case, we use the 1st machine 5 times, we get 1$ everytime, then we use the 2nd machine 5 times, and there is a good chance we get nothing out of this machine. So now we think that the best machine is the 1st one, and we only use it.
This is not optimal, we need to find a compromise between exploiting the best machine we found so far, and exploring to find a better machine.
Fortunately there are several efficient algorithms to maximize our gains.
Exploration, then exploitation (“Epsilon-first strategy”)
I explained this method in the previous example, this method consists in first trying the various actions, then always selecting the best action. When doing this method we hope that we accurately modelled each machine’s behaviour.
Exploitation, and a bit of exploration (“Epsilon-greedy strategy”)
We select \(\epsilon\) between 0 and 1, 0.1 for instance, and with a probability of \(\epsilon\) we select a random machine, and the rest of the time (with a probability of $1-\epsilon$) we select the best machine we found so far. This is a good compromise between exploiting the best machine, and exploring. But this method depends on the choice of \(\epsilon\): how can we find the best \(\epsilon\)?
An efficient mix of exploration and exploitation: UCB
(UCB stands for Upper Confidence Bound, from the paper Finite-time Analysis of the Multiarmed Bandit Problem
The algorithm is pretty simple, at every turn we need to play the machine that maximizes \(\bar x + \sqrt{\frac{2 ln(n)}{n_j}}\) where:
- $\bar x$ is the average reward obtained with the machine $j$
- \(n\) is the overall numbers of plays done so far
- \(n_j\) is the number of plays done on the machine $j$.
(In case of a tie, just choose a random machine among the best)
Applying MAB to our advertising problem:
We can view our advertising task as a Multi-Armed Bandit problem: at each turn (when a visitor requests a page), we can serve one ad from a list (i.e. one action), and get the visitor to click on the ad, or not (the reward).
Let’s get to the code!
Evaluating the efficiency
In order to know if your method is efficient, we have a ground truth about the behaviour, on each page we know the probabilities that visitors will click on each ad.
For $n$ different pages and $m$ different articles, we have a matrix $P$ of $n$ lines and $m$ columns where $P_{i,j}$ is the probability that a visitor on the page $i$, when presented with the ad $j$, will click on the ad.
Let’s start with the data
The ground truth is a file like this:
0:0.74;0.83;0.07;0.17;0.14:0.10;0.19;0.0;0.10;0.03;0.07;0.23;0.0;0.0;0.07
1:0.16;0.13;0.43;0.99;0.04:0.0;0.0;0.0;0.02;0.0;0.0;0.02;0.0;0.14;0.32
2:0.48;0.56;0.04;0.96;0.18:0.10;0.13;0.0;0.09;0.07;0.0;0.0;0.0;0.01;0.19
3:0.62;0.19;0.13;0.43;0.29:0.0;0.15;0.0;0.12;0.11;0.0;0.01;0.03;0.0;0.08
...
4999:0.75;0.49;0.11;0.33;0.87:0.0;0.11;0.0;0.36;0.03;0.0;0.0;0.12;0.0;0.14
(see the original file on my GitHub)
The format of each line is N:page description:ads click rate.
In this example we have a website of 5000 pages/articles, each indexed by a number from 0 to 4999.
For the moment we don’t really care about the page description, but we will use it later to make a more refined system.
The article description, or context, consists of 5 variables, which could be the relation of this article with particular topics. For instance the first article, number 0, is 74% about politics, 83% about environment, 7% about technology, and so on, while the second article, number 1, is only 16% about politics, 13% about environment, and 43% about technology.
Following the page description we find the ads click probabilities. Here we have 10 different ads. According to the previous excerpt, 10% of users that visited the article number 0 clicked on the ad number 0, and the most clicked ad on this article is the ad number 6 with a 23% click rate. On the other hand readers of article number 1 preferred ad number 9: 32% of these readers clicked on this ad.
Parsing the data:
import numpy as np
import pandas as pd

filepath = "CTR.txt"
with open(filepath, 'r') as f:
    data = f.read()

# A list of all the known articles ID
all_articles_id = []

# The matrix of articles description, one line per article
contexts = []

# Probabilities of ad click, one line per article
probas = []

for line in data.split('\n'):
    if ':' in line:
        [art_id, ctx, proba] = line.split(':')
        all_articles_id.append(int(art_id))
        contexts.append([float(s) for s in ctx.split(';')])
        probas.append([float(s) for s in proba.split(';')])

# Transform python lists into numpy arrays
contexts = np.array(contexts)
probas   = np.array(probas)


article_ids = all_articles_id
n_articles = len(article_ids)
n_advertisers = probas.shape[1]
Simulate a scenario
To evaluate an ad selection method, we will simulate visits on our website.
The global structure is the following
n_visits is the number of visitors we want to simulate
n_clicks = 0

# Simulate each visit one after another
for it in range(n_visits):
    # The visitor requests a random article
    article = np.random.choice(article_ids)
    # We select an ad
    advertiser = selection(...)
    # We simulate the visitor's choice by getting random number between 0 and 1
    # if the random number is under the probabilities of the selected ad on
    # the current article, we consider that the visitor has clicked on the ad.
    if np.random.rand() < probas[article, ad]:
        n_clicks += 1
We have now an estimation of the number of ad clicks for this method.
Plotting utilities
We will also add some plotting utilities to visualize the performances of these methods.
We are interested in seeing the evolution of ads clicked as time advances, and the evolution of the click rate is very informative. If our algorithm can effectively learn, we should see not only the number of clics rise, but the click rate will also soar!
import matplotlib.pyplot as plt
import IPython.display as disp
%matplotlib inline

do_plot = True

def plot_clicks(n_visits, x_values, y_values, ylim=None):
""" Plot the number of ads clicked in function of the number of articles seen"""
    disp.clear_output(wait=True)
    plt.plot(x_values, y_values)
    plt.title("Evolution of click number")
    plt.xlabel("Articles seen")
    plt.ylabel("Ads clicked")
    plt.xlim(0, n_visits*1.1)
    if ylim is None:
        plt.ylim(0, n_visits/3)
    else:
        plt.ylim(0, ylim)
    plt.show()

def plot_rate(n_visits, x_values, y_values, ylim=None):
""" Plot the clickrate to known if our algorithms are learning or not """
    disp.clear_output(wait=True)
    plt.plot(x_values, y_values)
    plt.title("Evolution of click rate")
    plt.xlabel("Articles seen")
    plt.ylabel("Click rate")
    plt.xlim(0, n_visits*1.1)
    if ylim is None:
        plt.ylim(0, 1)
    else:
        plt.ylim(0, ylim)
    plt.show()
The baselines
In order to evaluate the peformance of our methods, we will compare our methods against simple algorithms. These baselines serve as a comparison to our methods, they have access to the ads click probabilities, which we won’t have when designing a “real system”. For instance one baseline will always present the best ad for a given page according to the ground truth.
Baseline: select a random ad
Each time a visitor requests a page, we present him a random ad.
n_visits = int(1e4)
n_clicks = 0
x_values = [] # The number of clicks at each iteration
y_values = [] # The number of pages visited at each iteration
for it in range(n_visits):
    article = np.random.choice(article_ids)
    advertiser = np.random.choice(probas[article])
    if np.random.rand() < advertiser:
        n_clicks += 1
    if (it+1)%1000 in (0,1):
        x_values.append(it)
        y_values.append(n_clicks)
        plot_clicks(n_visits, x_values, y_values)
print("%d clicks, click rate: %f" % (n_clicks, n_clicks/n_visits))
Output (we plotted the number of ads clicked):
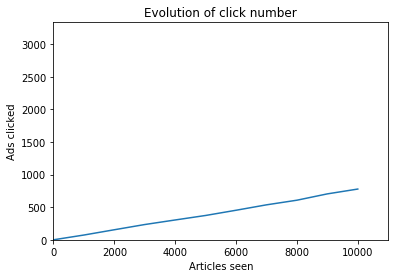
778 clicks, click rate: 0.077800
So when presenting a random ad to each visitor, we get 778 clicks for 10,000 visits, with amounts to 7.8% of ads clicked, which is not a lot! Our goal is to do something better.
Baseline: present the best ad, independant of the article
We find the best ad among all, and we will always present this ad, no matter the page requested
n_visits = int(1e4)

# We select the best ad probability
agg_clickrate = np.mean(probas, axis=0)
best_rate = max(agg_clickrate)

n_clicks = 0
x_values = []
y_values = []

for it in range(n_visits):
    article = np.random.choice(article_ids)
    if np.random.rand() < best_rate:
        n_clicks += 1
    if (it+1)%1000 in (0,1):
        x_values.append(it)
        y_values.append(n_clicks)
        plot_clicks(n_visits, x_values, y_values)

baserate_staticbest = n_clicks/n_visits
print("%d clicks, click rate: %f" % (n_clicks, n_clicks/n_visits))
Output (we plotted the number of ads clicked):
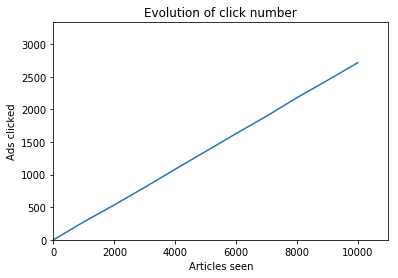
2715 clicks, click rate: 0.271500
This is better: we have a click rate of 27%, but the best baseline does something even better:
Baseline: always select the best ad for a given page
n_visits = int(1e4)

n_clicks = 0
x_values = []
y_values = []

for it in range(n_visits):
    article = np.random.choice(article_ids)
    if np.random.rand() < max(probas[article]):
        n_clicks += 1
    if (it+1)%1000 == 0:
        x_values.append(it)
        y_values.append(n_clicks/(it+1))
        plot_rate(n_visits, x_values, y_values, ylim=0.5)

baserate_optimal = n_clicks/n_visits
print("%d clicks, click rate: %f" % (n_clicks, n_clicks/n_visits))
Output (we plotted the click rate):
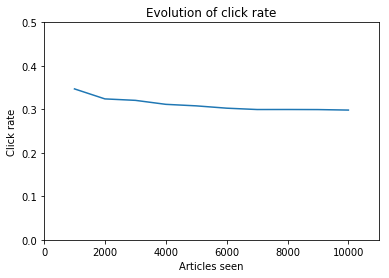
2983 clicks, click rate: 0.298300
So 29.8% seems the be the best score we can achieve. When designing a system for this website, even if we could access our visitors mind to know the click probabilities, we couldn’t achieve more than 29.8% of success.
On the previous graph we saw that this system is optimal and doesn’t learn, the click rate is pretty much constant.
Our goal is to design a system that learns, so at first it should perform like the random baseline, achieving a score of ~7%, then improving to a an optimal score of ~29%. This is why we plot the click rate, and not only the number of ads clicked. When seeing only the evolution of the number of clicks, we can’t easily see the improvements of our system, while it’s pretty obvious on the click rate graph:
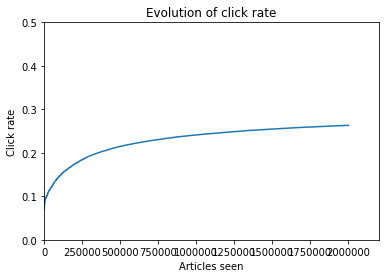
This is the result of the system we will be designing, at first it has a click rate under 10%, then it improves and achieves optimal scores.
Our first method: UCB
The principle: select the ad that maximizes \(\bar x + \sqrt{\frac{2 ln(n)}{n_j}}\).
# The number of trials for every ad on every page.
# trials[i,j] is the number of times we served ad #j on page #i
trials    = np.zeros_like(probas)
# The number of clicks for all ads on all pages, same principle as for `trials`
successes = np.zeros_like(probas)

# In case we don't have any data on an ad:
unknown_proba = 1
# To see the ads we presented for every article
ads_by_article = {}

n_visits = int(2e6)
n_clicks = 0
x_values = []
y_values = []

for it in range(1, n_visits+1):
    article = np.random.choice(article_ids)
    # Compute the success rate for every situation (ads/page)
    probas_estim = successes/trials
    # Replace every missing value (infinity) by 1 (the unknown proba)
    # This forces us to present each ad at least once
    probas_estim[np.isinf(probas_estim)] = unknown_proba
    # Select the best ad given the previous formula
    chosen_ad = np.argmax(probas_estim[article] \
                          + np.sqrt(2*np.log(it)/trials[article]))
    trials[article, chosen_ad] += 1
    if article in ads_by_article:
        ads_by_article[article].append(chosen_ad)
    else:
        ads_by_article[article] = [chosen_ad]
    if np.random.rand() < probas[article, chosen_ad]:
        n_clicks += 1
        successes[article, chosen_ad] +=1
    if (it+1)%1000 in (0,1):
        x_values.append(it)
        y_values.append(n_clicks/it)
        plot_rate(n_visits, x_values, y_values, ylim=0.5)

print("%d clicks, click rate: %f" % (n_clicks, n_clicks/n_visits))
Output:
526361 clicks, click rate: 0.263180
We designed a system that learns and improves! This algorithm learns the ads that are clicked by visitors, while exploring to model the visitors behaviour.